
Simulated co-mutation profiles for rare-cancer drug-target prioritisation.
A Gaussian copula joint fitted to the indication's real anchor cohort under Ledoit-Wolf shrinkage. Pairwise odds-ratio validation against the co-occurrence audit. Bootstrap confidence intervals propagated over the real anchor n. A linear baseline fitted on measured expression and held out by sample, per Ahlmann-Eltze 2025.
The size of the evidence sets the size of the claim.
Rare-cancer anchor cohorts are below n=100 even after pooling every public dataset.
Joint structure, not marginals
The biology that matters in rare cancer is the joint mutation structure, not gene-level frequencies. We fit a Gaussian copula to the real anchor cohort, with Ledoit-Wolf shrinkage toward a biology-informed prior rather than a naive independence assumption.
Co-occurrence audit, DISCOVER-inspired
Every cohort is audited with an approximate pairwise co-occurrence test that borrows DISCOVER's central idea (Canisius 2016): the per-cell probability depends on each tumour's own alteration rate, so a hyper-mutated case raises its own expected co-occurrence rather than driving a spurious signal, which is what Fisher's exact test gets wrong. It is not the DISCOVER test itself. The null is a closed-form marginal product summarised by its mean and variance and tested with a two-sided normal approximation, Bonferroni corrected. That approximation is weakest at small expected counts, which is where several genes in this cohort sit, so marginal p-values are indicative rather than decisive. The headline figure is the 45 degree agreement plot: observed log OR in the real anchor versus realised log OR in the simulated draws.
Bootstrap CIs over the real anchor n
Confidence intervals shrink with the real anchor n (60 for DMG), not the simulated draw count. A 1,000-draw simulated cohort drawn from n=60 reports intervals reflecting n=60. The draws are a Monte Carlo resolution parameter, not an information parameter.
A linear baseline, and an honest one
Ahlmann-Eltze 2025 (Nature Methods) found that deep-learning perturbation models did not outperform a simple linear baseline on standard benchmarks, so reporting a linear baseline is not optional. Ours is fitted on measured per-cell expression from a 40,000-cell reference and held out by SAMPLE across 47 10x records, not by cell, because cells from one record are not independent. That reference is a mixed cohort and the mix is stated rather than implied: about half its cells come from a record that is both high-grade glioma and a stated midline site, the rest are hemispheric, site-unstated, or ependymoma comparators from the original study, and H3 K27M status is recorded on no record in the deposit. Each cell-state programme reaches R2 between 0.44 and 0.52 on samples it never saw, and it recovers canonical astrocyte and myelin genes after each programme's own defining markers were withheld from its features. Separately, the per-stratum ordering in a report comes from a stated rule set that is evaluated exactly rather than fitted. Nothing is learned from the draws there, the assumptions are printed next to the number, and the Honesty Critic reports where that ordering disagrees with the second layer without deciding which is right. That second layer is a stated pathway rule set, its terms drawn from published DMG target-class pathway mechanism and evaluated in process, so the disagreement is between two independent sets of stated assumptions rather than between a model and a stand-in for one. It abstains for any target class not in its registry.
Anchor. Fit. Validate. Predict. Cite.
Step 1 / 5
Real cBioPortal pulls
DMG: pooled pediatric cohorts from Gröbner (Nature 2018, n=53) and Petralia (Cell 2020, n=7), giving 60 K27M samples across both the H3.3 and H3.1 histone variants. All public cBioPortal datasets.
Step 2 / 5
Gaussian copula joint
Per-gene rates estimated from the anchor, then coupled through a latent Gaussian on the shrinkage-stabilised correlation matrix, so the cohort preserves the observed co-mutation structure rather than assuming independence.
Step 3 / 5
Biology-informed shrinkage
At n=60 across 13 genes there are more cases than columns, so nothing about the shape of the matrix forces it to be singular, but the empirical correlation matrix is rank 10 all the same: three of the 13 genes have no carrier in any of the 60 cases, their variance is zero, and their correlations are therefore undefined rather than small. The ten that do vary are not trustworthy either, because several carry fewer than ten cases, so their pairwise co-occurrence counts are small and the correlation estimates are high-variance. Ledoit-Wolf shrinkage trades a little bias for a large reduction in that variance, at an intensity of 0.577 on the current anchor. Standard practice shrinks toward the identity, which zeroes out canonical biology, so we shrink toward a sparse literature-derived target of established co-mutation relationships instead. One consequence: mapping binary correlations onto the latent Gaussian scale does not preserve positive-definiteness, so the latent matrix has to be repaired before it can be sampled from. We use Higham's nearest correlation matrix, which finds the closest valid matrix in Frobenius norm and so repairs the structure that broke rather than attenuating every correlation uniformly. An earlier version blended every off-diagonal correlation 35 percent toward independence, which cut the strongest correlation in the matrix from 0.81 to 0.62; replacing it improved the mean pairwise log-OR residual from 0.955 to 0.842, where lower is closer to the anchor. The fine joint is still regularised, by the shrinkage and by that repair, so the marginals remain the layer to trust.
Step 4 / 5
Co-occurrence audit + bootstrap
The DISCOVER-inspired co-occurrence audit applied to both the anchor and the simulated draws, with the 45 degree agreement plot shipped as Figure 1. Bootstrap CIs computed by resampling the real anchor n with replacement 1,000 times and recomputing each gene frequency on every resample. Intervals are honest about the underlying information.
Step 5 / 5
PubMed retrieval · real CellOracle · dependency and escape layers placeheld
Per subgroup: PubMed retrieval over title-and-abstract embeddings via pgvector, plus a CellOracle in-silico knockout over a DMG base regulatory network built from four real DMG scATAC-seq samples unioned with CellOracle's published human promoter network and a 40,000-cell malignant reference whose donors are mostly midline high-grade glioma and not only that: roughly half its cells come from a record stating both, and the rest are hemispheric, site-unstated or ependymoma comparators, with H3 K27M status recorded nowhere in the deposit. That layer is real model output, precomputed and served as an artifact, covering the 45 transcription-factor regulators that returned signal plus ACVR1 through an explicitly labelled bridge to its downstream TFs. The promoter half is 65.33% of that network's rows, and rebuilding on the DMG scATAC rows alone and re-sweeping every candidate, measured 2026-08-13, leaves the top four identical in order against a same-process control that reproduced exactly, so the ordering does not rest on the generic majority. It buys nothing on specificity: the strongest immediate-early comparator, FOS, gets stronger without the promoter rows, and 26 of 47 targets read exactly zero on that readout in both arms. It abstains for any other target rather than substituting a heuristic. The readout is an uncalibrated ordering signal, not a probability. The dependency layer serves a measured CRISPR beta on eleven of its seventeen rows, each measured in that row's own cell line by the CCMA pooled screen (Mendeley Data, CC BY 4.0; Sun, Daniel and Firestein, who do not endorse Onkydra), and an explicit null on the other six. Nothing from DepMap is ingested, and no DepMap lookup happens on any run. The escape layer is a literature-derived shortlist of named mechanisms with citations and no score, because no LINCS or CMap signature query has ever been run. Both are declared as placeholders in the report. Every report claim cited at source. Honesty Critic refuses sentences without retrieved evidence.
One cancer is wired. The second is a method check, not an indication.
H3 K27M diffuse midline glioma is the only indication this workspace accepts. Ewing sarcoma is held at Planned in the capability register: its anchor cohort is built, and nothing reaches it, because the coverage gate refuses it. Built is not the same as wired.
One component carried, not the engine. The cohort sampler ran once on the Ewing anchor and reproduced its published marginals. No mechanistic, screen or matching layer has ever run for it, so the card below is evidence about a sampler and about nothing else.
Every layer that is specific to this disease is named rather than summarised, and each one states the data that would remove it. The register is checked in, correspondence-checked against the files it names, and published on the limitations page.
H3 K27M diffuse midline glioma
Anchor n=60 · DKFZ + CPTAC pediatric
- · Reproduces the canonical co-mutation couplings documented in the DMG literature (Mackay 2017, Sturm 2012).
- · Applies the expected H3.1 versus H3.3 subgroup structure (2014 DIPG genomics series).
- · Holds known mutual-exclusivity relationships without overstating them.
Context: dordaviprone (Modeyso) FDA-approved 2025-08-06 on a pooled n=50. The size of the evidence is the size of the field.
Ewing sarcoma
Anchor n=222 · Crompton 2014 + Tirode 2014
- · EWSR1::FLI1 prevalence reproduced at 86.5 % vs literature 85 %.
- · STAG2 13.1 %, TP53 9.5 % marginals, both within published ranges.
- · STAG2 + TP53 co-occurrence (Tirode 2014 headline) does NOT reach Bonferroni significance in our n=222 extract.
The CDKN2A undercount (cohort 0.9 % vs literature 13 %) is a known cBioPortal CNA gap, declared in the report header. Ewing is held at Planned in the capability register: the anchor is built and nothing reaches it, because it is absent from the supported list and the coverage gate refuses it. Built is not the same as wired, and none of the mechanistic, screen or matching layers was ever run for it.
Co-occurrence agreement at 45 degrees: observed vs simulated log odds ratios.
For every gene pair where both genes have at least one carrier in the anchor, plot the observed log odds ratio in the real anchor (x-axis) against the realised log odds ratio across 1,000 simulated profiles drawn from the Gaussian-copula joint (y-axis). The diagonal is a reference line, not the target. Ledoit-Wolf shrinkage and the nearest-correlation repair pull the joint deliberately toward independence, because pairwise co-occurrence at this anchor size is unreliable, so a scatter sitting on the line would mean the anchor’s noisy pairwise structure had been reproduced rather than shrunk. What the figure is evidence of is the spread and the identity of the outliers.
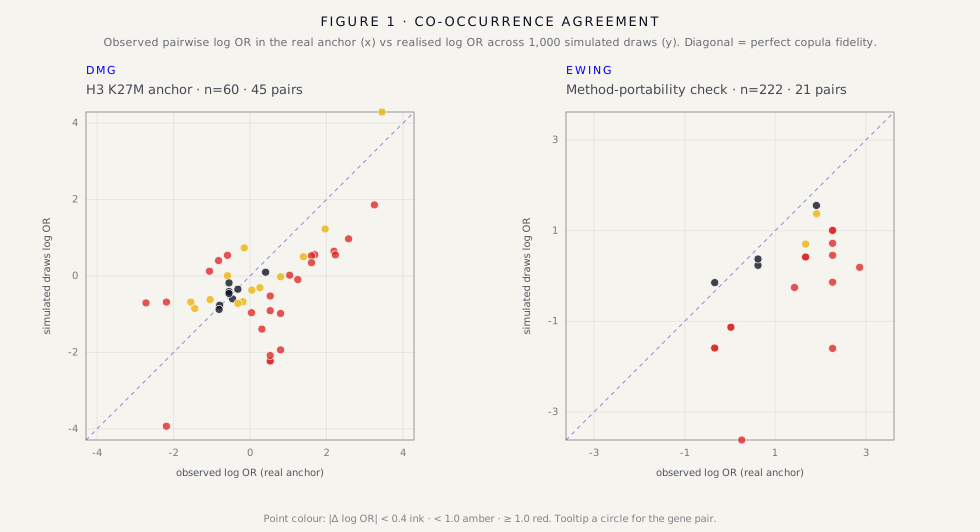
Point colour by |Δ log OR|: ink < 0.4, amber < 1.0, red ≥ 1.0. DMG (n=60) shows wider scatter than the larger Ewing anchor (n=222), which is what a smaller anchor should look like. Ewing is not a selectable indication; it is here as a method-portability check.
Knowledge gaps, declared.
Every generated report carries these caveats in its header.
CDKN2A CNA gap (Ewing)
cBioPortal's mutations endpoint excludes copy-number alterations. CDKN2A loss in Ewing is dominantly homozygous deletion (Brohl 2014: 13.8 % tumours, 50 % cell lines). Closeable with a parallel copy-number pull.
H3.1 K27M under-representation (DMG)
H3.1 K27M is modelled at the ~25 % literature consensus rather than the cohort figure. The corrected anchor observes 11 of 60 (18.3 %), so the subgroup is present but slightly under-represented against the 20-25 % literature range. The earlier zero was a derivation bug, not sampling: the pull queried H3-3A and H3C3 and missed HIST1H3B (H3C2). Cohort-internal H3.1 biology is still parameterised from the literature at this anchor size.
Mutation-only modelling
Current matrix is binary mutation status. Mutation type, allele frequency, copy-number burden, methylation state, fusion subtype tracked in the raw extract but not in the joint. Planned extension.
The methodology is documented and citable.
Anchor cohorts versioned by ISO fetch date, built from public datasets. Citations below. The full preprint is in draft and not yet posted, and the implementation is proprietary.
Mackay A et al.
Cancer Cell 2017 · PMID 28966033
Tirode F et al.
Cancer Discov 2014 · PMID 25223734
Crompton BD et al.
Cancer Discov 2014 · PMID 25186949
Buczkowicz P et al.
Nat Genet 2014 · PMID 24705254
Brohl AS et al.
PLoS Genet 2014 · PMID 25010205
Grünewald TGP et al.
NRDP 2018 · PMID 29977051
Canisius S et al.
Genome Biol 2016 · PMID 27084392
Ahlmann-Eltze C et al.
bioRxiv 2025 · 10.1101/2024.09.16.613342
Filbin MG et al.
Science 2018 · PMID 29674595
Anderson ND et al.
Nat Med 2018 · PMID 29334373